Week of August 28, 2023 in Review
There are signs of weakening in the labor market. Find out why this matters, plus what’s really going on with inflation and housing.
- Labor Market Lower and Slower
- Private Payrolls Weaker Than Expected
- Media Misinterpreting Inflation
- Pending Home Sales Rise for Second Straight Month
- Strong Home Price Growth Continues
Labor Market Lower and Slower

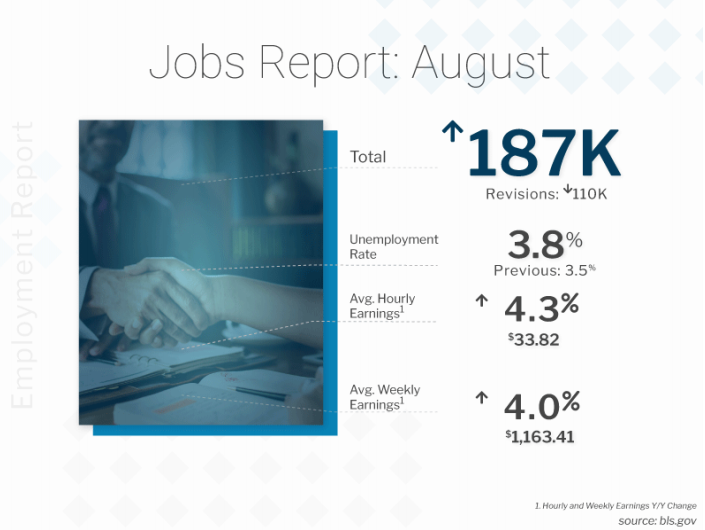
The Bureau of Labor Statistics (BLS) reported that there were 187,000 jobs created in August. While this was slightly better than estimates, job growth in June and July was revised lower substantially, subtracting 110,000 jobs in those months combined. The unemployment rate also rose from 3.5% to 3.8%.
What’s the bottom line? Job gains are clearly slowing, with the last three months averaging just 150,000new jobs per month. This is compared to an average of 194,000 over the last six months, 257,000 over the last twelve months, and the 2022 average of 399,000 new jobs per month.
Job growth also continues to be revised lower in subsequent reports. For example, June’s originally reported number of 209,000 new jobs has been cut in half to just 105,000 jobs (which is the lowest reading in almost three years). Growth figures for July and August are likely to be revised lower as well. Plus, a deeper look at the data for August shows that part-time workers increased by 32,000, while full-time workers fell by 85,000. All these factors point to a weakening job market
The Fed has been looking for clear signs that the labor market is softening as they consider further rate hikes. Will this report be enough to convince them to pause at their next meeting? We’ll find out on September 20.
Private Payrolls Weaker Than Expected

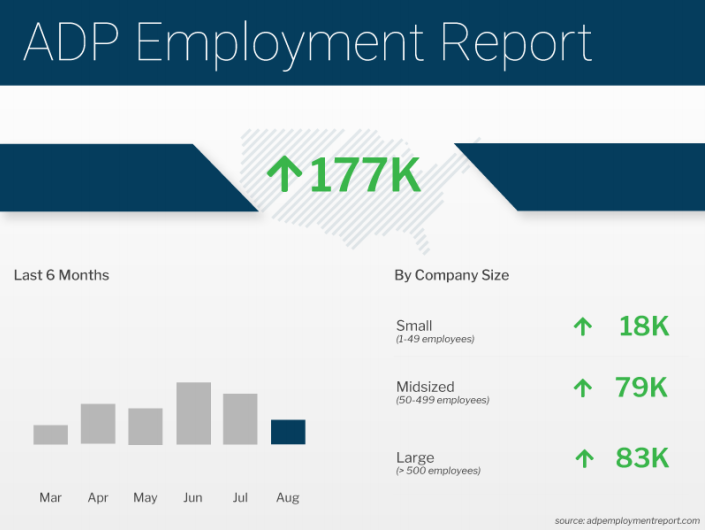
The ADP Employment Report showed that private payrolls were weaker than forecasted in August, with 177,000 jobs created. Most of the gains came in the services sector, spread fairly evenly between trade/transportation/utilities, education/health services, and leisure/hospitality.
ADP said that “job growth slowed notably last month, driven heavily by leisure and hospitality.” That sector added 30,000 jobs in August, finally cooling after months of strong gains that may have been overstated due to seasonal adjustment issues.
What’s the bottom line? Annual pay for job stayers increased 5.9% and job changers saw an average increase of 9.5%. While these figures are still high, they have cooled considerably from last year’s highs of 8% for job stayers and 16% for job changers. This is significant because it suggests lower wage-pressured inflation.
Media Misinterpreting Inflation
July’s Personal Consumption Expenditures (PCE) showed that headline inflation increased 0.2%, while the
year-over-year reading rose from 3% to 3.3%. Core PCE, which strips out volatile food and energy prices, also rose by 0.2% in July with the year-over-year reading up from 4.1% to 4.2%.
What’s the bottom line? With the latest PCE data showing an increase in annual inflation, some media analysts suggested that the Fed should continue raising the Fed Funds Rate. This is the overnight borrowing rate for banks and the Fed has been hiking this rate to slow the economy and curb inflation.
However, it’s important to look closely at the data, as inflation is calculated on a rolling 12-month basis. A lower comparison from July 2022 was removed and replaced with the 0.2% reading for this July, causing the annual rate to rise. Inflation has actually made significant progress lower from the 7% peak seen last year and is now less than half that amount at 3.3% on the headline reading.
Plus, if we annualize the last five months’ worth of readings, which provide a more current and relevant trend, inflation is running at a 2.2% pace on headline PCE and 3.2% pace for Core PCE. While this is higher than the Fed’s 2% target, these readings are lower than the annual readings reported for July and show the lower direction inflation has been heading.
Pending Home Sales Rise for Second Straight Month

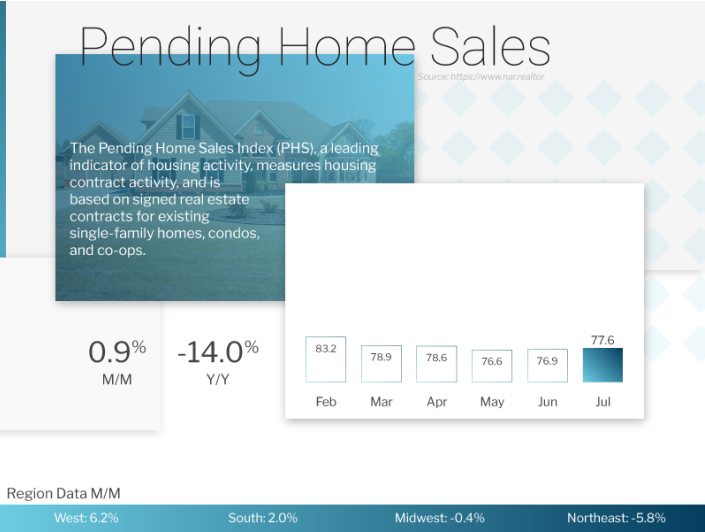
Pending Home Sales rose 0.9% from June to July, which was much stronger than estimates of a 0.6% drop. While sales were down 14% from a year earlier, this is not from a lack of demand but a lack of inventory, which was nearly 15% lower over the same period. Pending Home Sales measure signed contracts on existing homes, which represent the largest segment of transactions, making this a crucial measure for
taking the pulse of the housing market.
What’s the bottom line? Despite the media’s best efforts to put a negative spin on this report, this was the second monthly increase in a row and shows strength in the housing sector, especially considering that July saw elevated mortgage rates and historically tight inventory. Lawrence Yun, chief economist for the National Association of REALTORS (NAR), noted that “the small gain in contract signings shows the potential for further increases in light of the fact that many people have lost out on multiple home buying offers.”
Strong Home Price Growth Continues

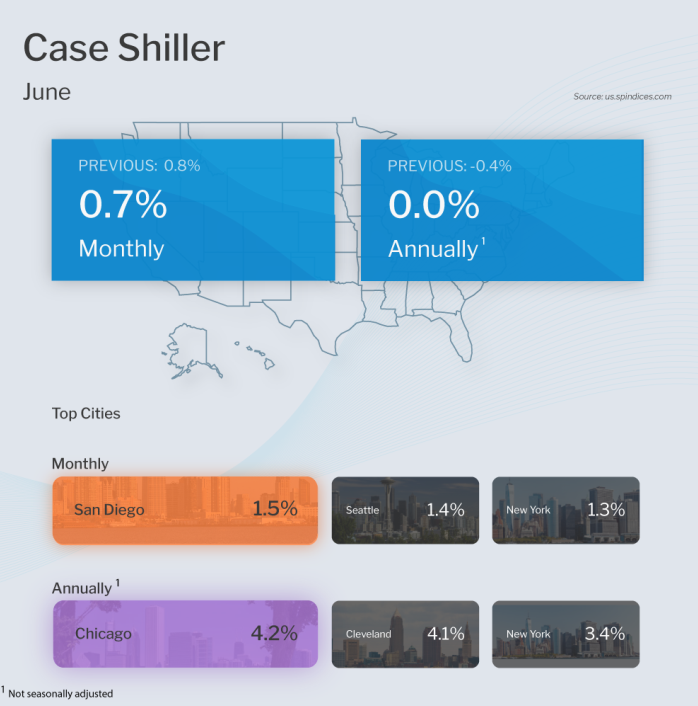
The Case-Shiller Home Price Index, which is considered the “gold standard” for appreciation, showed home prices nationwide rose 0.7% from May to June after seasonal adjustment, marking the fifth consecutive month of gains. Prices were flat when compared to June 2022, which was when prices peaked in this report.
The Federal Housing Finance Agency (FHFA) also released their House Price Index, which revealed that home prices rose for the sixth straight month, up 0.3% from May to June. Prices also rose 3.1% from June 2022 to June 2023.
Note that FHFA’s report measures home price appreciation on single-family homes with conforming loan amounts, which means it most likely represents lower-priced homes. FHFA also does not include cash buyers or jumbo loans, and these factors account for some of the differences in the two reports.
What’s the bottom line? Home values are setting new all-time highs according to FHFA, CoreLogic, Black Knight and Zillow, more than recovering from the downturn we saw in the second half of 2022. New highs are also expected in Case-Shiller’s next report, given that home values have returned to the highs seen last year. These appreciation indexes show that now remains a great opportunity for building wealth through real estate.
Family Hack of the Week
This week marks National Cheese Pizza Day on September 5. Impress your family and friends with this homemade dough from All recipes that’s easy-to-make and downright delicious.
Preheat oven to 450 degrees Fahrenheit. Lightly grease a pizza pan. Add 1 cup warm water to a medium bowl. Add 1 package active dry yeast (.25 ounce) and 1 teaspoon sugar. Mix and let stand until creamy, around 10 minutes.
Add 2 1/2 cups bread flour, 2 tablespoons olive oil and 1 teaspoon salt to the yeast mixture. Beat until smooth either by hand or using a stand mixer with a dough hook. Let rest for 5 minutes.
Turn dough onto a lightly floured surface and roll into a 12-inch circle. Transfer to the prepared pizza pan, top with sauce and mozzarella cheese. Bake until cheese is bubbling in the middle and crust is golden brown, about 15 to 20 minutes. Let cool for a few moments before serving.
What to Look for This Week
After the market closures Monday for Labor Day, this week’s calendar is much quieter than last week’s, highlighted by Thursday’s release of weekly Jobless Claims and second quarter Productivity.
Technical Picture
Mortgage Bonds ended last week trading in a tight range between the ceiling of resistance at the 98.716 Fibonacci level and support at the 25-day Moving Average. The 10-year moved higher on Friday, testing the ceiling at 4.20%, which held last week.

