Week of December 4, 2023 in Review
The latest labor sector data showed mixed results, while home prices increased. Here are the highlights:
- BLS Jobs Report Not What We Wanted
- Private Payrolls Below Expectations
- Job Openings Lower
- Jobless Claims
- Home Prices Hitting Highs
BLS Jobs Report Not What We Wanted

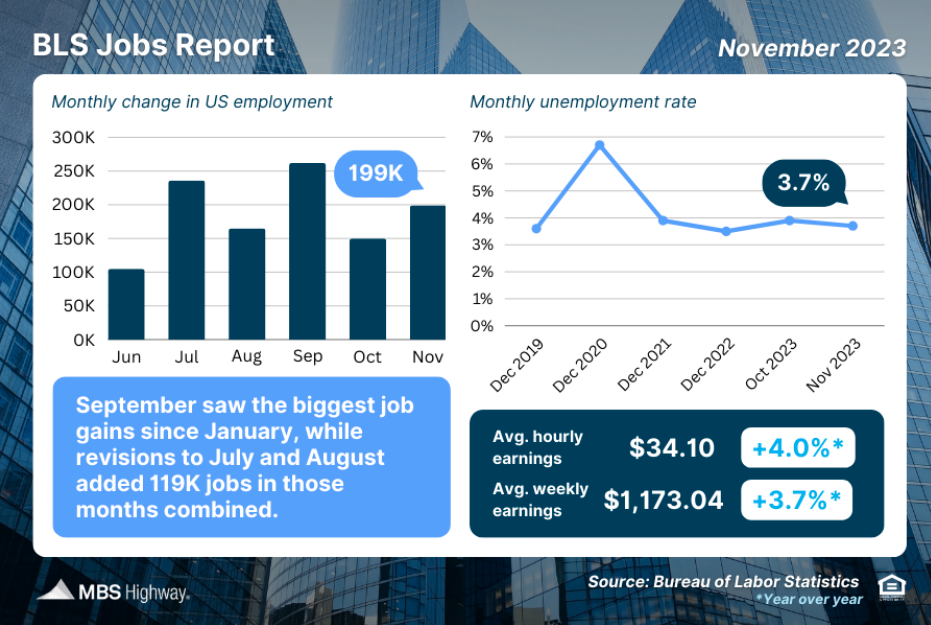
The Bureau of Labor Statistics (BLS) reported that there were 199,000 jobs created in November versus the 190,000 forecasted. Revisions to September and October shaved 35,000 jobs in those months combined. The unemployment rate fell from 3.9% to 3.7%.
The Household Survey, where the Unemployment Rate comes from, is considered more real-time because it’s derived by calling households to see if they are employed. This survey has its own job creation component, which showed 747,000 job gains.
Average hourly earnings were up 0.4% in November, and while that was higher than expected, the yearover-year figure continues to decelerate and now stands at only a 4% increase. This is important as this decline translates to less wage-pressured inflation

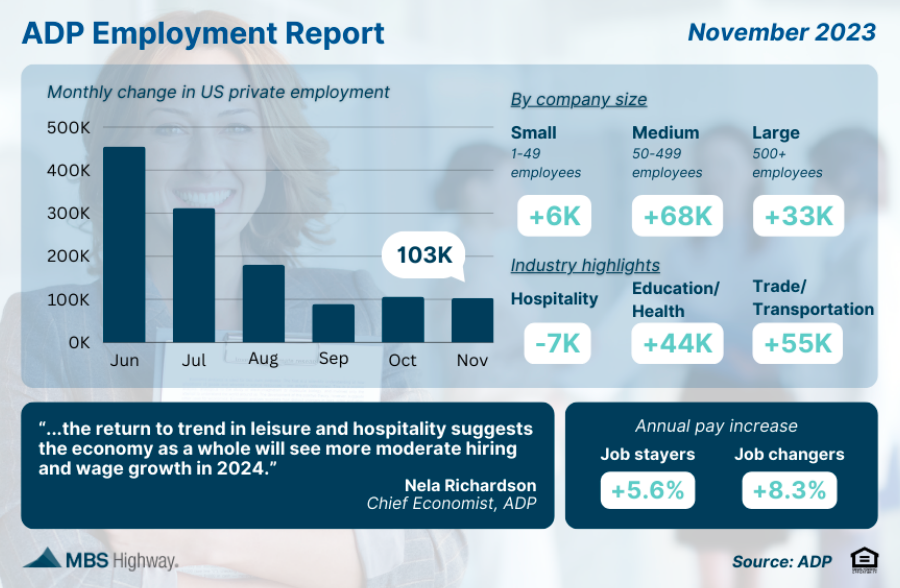
ADP’s Employment Report showed that private payrolls were weaker than forecasted in November with 103,000 jobs created. Almost all the job growth came in service-providing industries. Within that sector, leisure and hospitality lost 7,000 jobs.
What’s the bottom line? Nela Richardson, chief economist for ADP, noted that, “Restaurants and hotels were the biggest job creators during the post-pandemic recovery. But that boost is behind us,” signaling that the labor market is changing.
Also of note, annual pay for job stayers increased 5.6% and job changers saw an average increase of 8.3%. These figures have cooled considerably from last year’s highs of 8% for job stayers and 16% for job changers, which is significant because it also suggests lower wage-pressured inflation.
Job Openings Lower
The latest Job Openings and Labor Turnover Survey (JOLTS) showed that job openings fell significantly to 8.7 million in October from 9.4 million in September, missing expectations. The hiring rate stayed the same at 3.7%, which is the lowest since the shutdowns during the pandemic. The quit rate at 2.3% was also unchanged for the fourth consecutive month, and this low rate suggests there’s a lack of employers trying to entice workers with other offers.
What’s the bottom line? Job openings are down by 1.7 million when compared to the same time last year. Plus, the reported total for this October is likely overstated. The increase in working from home means job listings are being posted in multiple states more frequently. As a result, they’re being overcounted in the JOLTS total, suggesting that the report may be even weaker than the numbers suggest.
Jobless Claims
Initial Jobless Claims rose by 1,000 in the latest week, with 220,000 people filing for unemployment benefits for the first time. Continuing Claims decreased by 64,000, showing that 1,861,000 million people are still receiving benefits after filing their initial claim.
What’s the bottom line? Though Continuing Claims fell by 64,000 in the latest week, the data is still one of the highest prints in over two years. Additionally, since this measure is delayed by two weeks, it encompassed the Thanksgiving holiday. Oftentimes, the seasonal adjustments do not accurately reflect real activity. Overall, the numbers shows that employers are trying to hold on to workers, but it’s becoming harder for people to find employment once they are let go.
Home Prices Hitting Highs

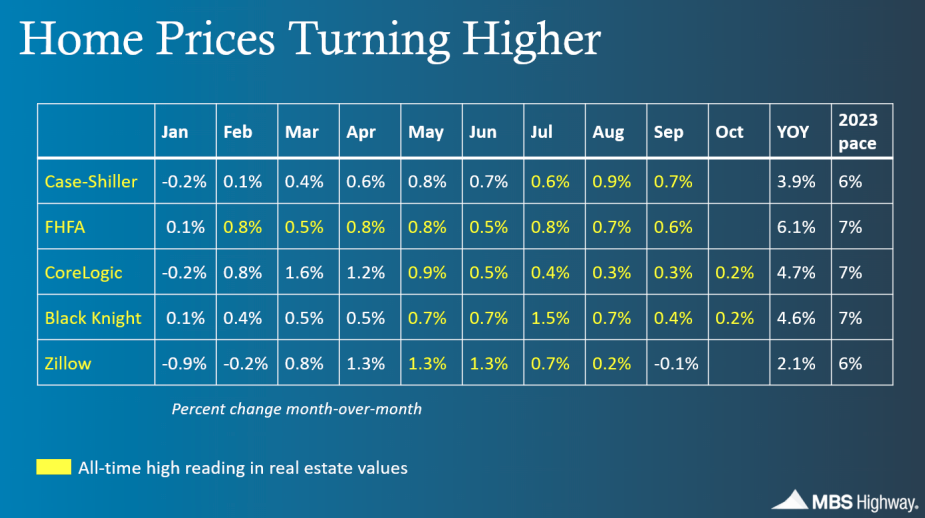
CoreLogic’s Home Price Index showed that home prices nationwide rose 0.2% from September to October, hitting a new all-time high for the sixth straight month. CoreLogic forecasts that home prices will remain flat in November and rise 2.9% in the year going forward, though their forecasts tend to be on the conservative side historically. In fact, CoreLogic’s index is on pace for 7% appreciation in 2023, based on the monthly readings we’ve seen so far this year.
Black Knight also reported that home prices rose 0.2% in October and 4.6% year over year. This is the sixth consecutive record high in home prices in their index. Based on the gains we have seen through the first 10 months of 2023, Black Knight’s index is also on pace for 7% full year appreciation.
What’s the bottom line? The latest rise in home prices reported by CoreLogic and Black Knight echoes the strong growth seen by other major indices like Case-Shiller, Zillow and the Federal Housing Finance Agency. These reports continue to demonstrate why homeownership remains a good opportunity for building wealth through real estate.
Family Hack of the Week
December is National Pear Month. This Pear Crisp courtesy of Taste of Home will be a winner with your family and friends all month long.
- Preheat oven to 350 degrees Fahrenheit.
- Peel and thinly slice 8 medium ripe pears.
- Toss with 1/4 cup orange juice and place in a greased 13×9-inch baking dish.
- Combine 1/2 cup sugar, 1 teaspoon cinnamon, 1/4 teaspoon allspice and 1/4 teaspoon ground ginger and sprinkle over pears.
- For the topping, combine 1 cup all-purpose flour, 1 cup old-fashioned oats, 1/2 cup packed brown sugar and 1/2 teaspoon baking powder in a small bowl.
- Cut in 1/2 cup cold butter until crumbly. Sprinkle over pears.
- Bake until the topping is golden brown and fruit is tender, about 35 to 40 minutes.
- Enjoy warm with your favorite vanilla ice cream.
What to Look for This Week
All eyes will be on the Fed’s two-day meeting which begins Tuesday, with their Monetary Policy Statement and press conference coming on Wednesday. The Fed will certainly be reviewing this week’s inflation data when November’s Consumer and Producer Price Indexes are reported on Tuesday and Wednesday, respectively.
Also of note, November’s Retail Sales and the latest Jobless Claims will be released on Thursday. Investors will also be closely watching Monday’s 10-year Note and Tuesday’s 30-year Bond auctions for the level of demand.
Technical Picture
Mortgage Bonds ended last week in a range between a dual level of support at the 200-day Moving Average and 38.2% Fibonacci level and resistance at 102.06. The 10-year ended trading in the middle of a wide range between the floor at the 38.2% Fibonacci level and the ceiling at the 100-day Moving Average.

