Week of January 29, 2024 in Review
The Fed held rates steady, while there were mixed messages from the labor sector and home prices continued to hit new highs. Read on for these stories and more:
- Fed Funds Rate “Likely at Its Peak”
- Was January’s Jobs Report Really a Blockbuster?
- Slow Start for Private Sector Job Growth
- Surprising Uptick in December’s Job Openings
- Unemployment Claims Rise for Second Straight Week
- Home Prices Moving on Up
Fed Funds Rate “Likely at Its Peak”
After a period of aggressive rate hikes that began in March 2022, the Fed once again left their benchmark Federal Funds Rate unchanged at a range of 5.25% to 5.5%. This decision was unanimous and marked the fourth straight meeting where the Fed paused additional hikes.
The Fed Funds Rate is the interest rate for overnight borrowing for banks and it is not the same as mortgage rates. The Fed’s eleven hikes between March 2022 and July 2023 were made to slow the economy and curb the runaway inflation seen over the last few years.
What’s the bottom line? The Fed said they believe they have reached their peak Fed Funds Rate for this cycle. However, members don’t expect to begin cutting rates until they have “gained greater confidence that inflation is moving sustainably toward 2 percent.” Note that the Fed’s favored measure, Core Personal Consumption Expenditures, declined to 2.9% annually as of the latest report for December.
During his press conference, Fed Chair Jerome Powell acknowledged that inflation data has been favorable over the last six months. However, he does not think the Fed will be ready to start cutting rates at their next meeting on March 20, explaining that members
want to see “more good data.”
Was January’s Jobs Report Really a Blockbuster?

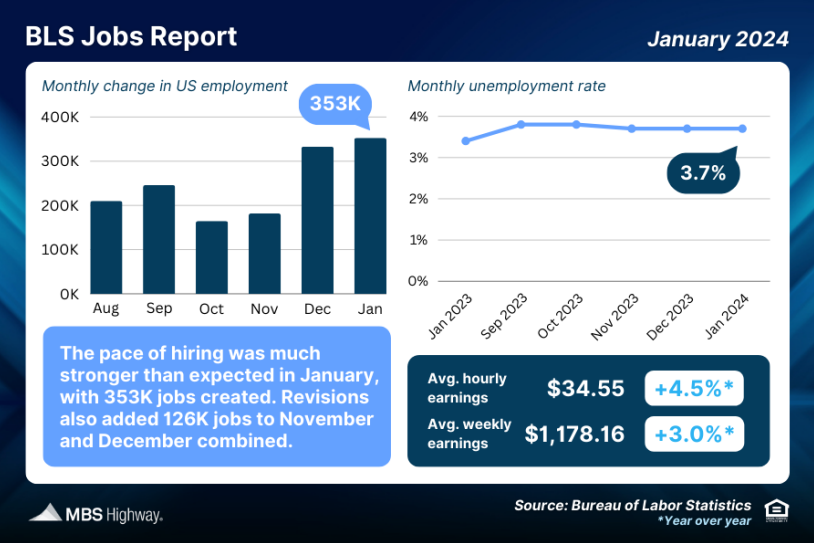
The Bureau of Labor Statistics (BLS) reported that there were 353,000 jobs created in January, which was nearly double expectations. Revisions to November and December also added 126,000 jobs in those months combined. The unemployment rate held steady at 3.7%.
What’s the bottom line? While the headline job growth figure for January appears strong on the surface, future revisions lower are a very real possibility. January is always a heavily adjusted month, as new benchmarks, seasonal adjustments and population controls play a big role in calculating the data.
In addition, there are two reports within the Jobs Report and there is a fundamental difference between them. The Business Survey is where the headline job number comes from, and it’s based predominately on modeling and estimations.
The Household Survey, where the Unemployment Rate comes from, is considered more real-time because it’s derived by calling households to see if they are employed. This survey has its own job creation component and it told a completely different story, showing 31,000 job losses.
Average weekly hours worked also declined to the lowest level since 2010 excluding the pandemic. This is important because one of the ways businesses cut costs is to cut the number of hours worked. On average the entire labor force is working 30 minutes fewer per week, which equates to 2.4 million job losses on its own.
Slow Start for Private Sector Job Growth

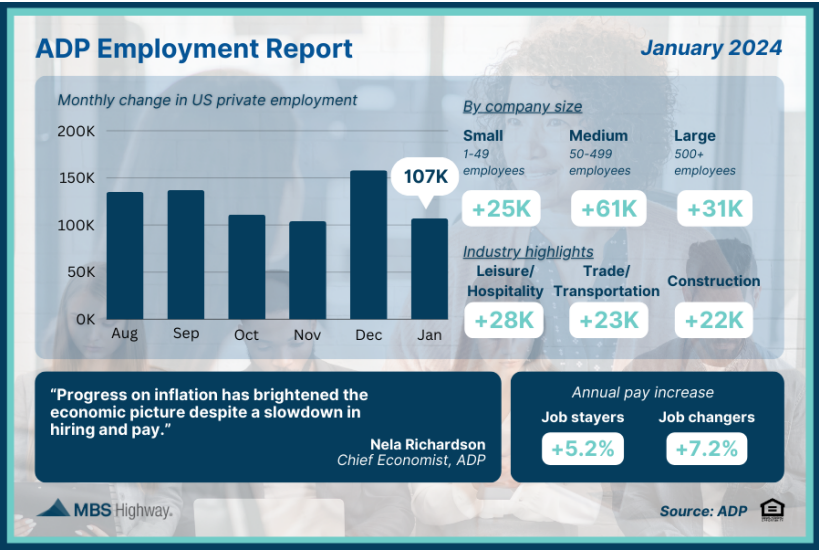
ADP’s Employment Report showed that private payrolls began 2024 slower than expected, as employers added just 107,000 new jobs in January. Most of the growth came in service-providing industries (+77K), with goods-producers adding the rest.
Annual pay for job stayers increased by 5.2% while job changers saw an average increase of 7.2%, though these figures have cooled considerably from recent highs. In addition, the difference between pay growth for job stayers versus job changers has also shrunk substantially, indicating there’s less incentive for switching jobs.
What’s the bottom line? Nela Richardson, chief economist for ADP, said, “Progress on inflation has brightened the economic picture despite a slowdown in hiring and pay.” She also noted that “wages adjusted for inflation have improved over the past six months, and the economy looks like it’s headed toward a soft landing in the U.S. and globally.”
Surprising Uptick in December’s Job Openings
The latest Job Openings and Labor Turnover Survey (JOLTS) showed that job openings were stronger than expected in December, rising from 8.925 million in November to 9.026 million. The hiring rate rose from 3.5% to 3.6% while the quit rate remained at 2.2%, suggesting there’s a lack of employers trying to entice workers with other offers.
What’s the bottom line? While the Fed watches this report to monitor slack in the labor market, there are flaws in the data. The increase in working from home means job listings are being posted in multiple states more frequently. As a result, they’re being overcounted in the JOLTS total so the report may be weaker than the headlines suggest, especially given the number of high-profile companies that have announced layoffs recently.
Unemployment Claims Rise for Second Straight Week
The latest weekly Initial Jobless Claims reached their highest level since November, as 224,000 people filed for unemployment benefits for the first time. Continuing Claims also surged higher, up 70,000 with 1.898 million people still receiving benefits after filing their initial claim.
What’s the bottom line? Both Initial and Continuing Jobless Claims have risen over the last two weeks to nearly three-month highs. Plus, the latest Job Cuts report from Challenger, Gray & Christmas showed that announced layoffs in January surged from December, and this could be reflected in future Unemployment Claim filings.
Home Prices Moving on Up

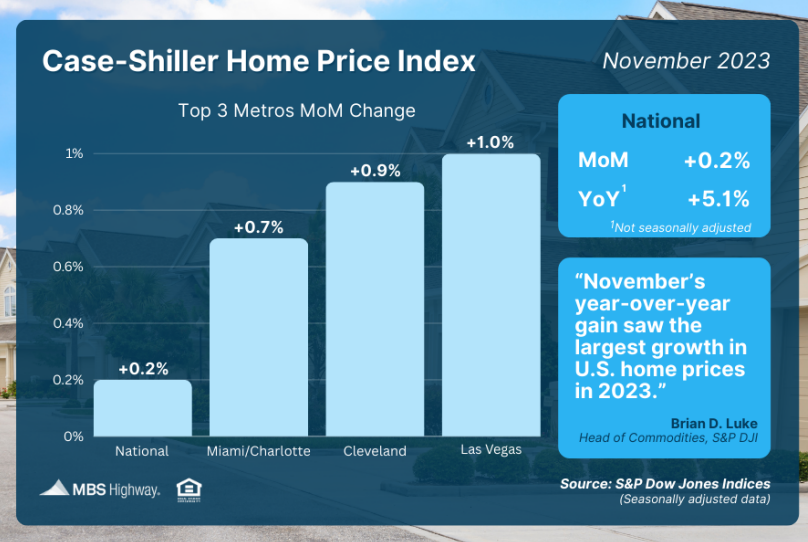
The Case-Shiller Home Price Index, which is considered the “gold standard” for appreciation, showed home prices nationwide rose 0.2% from October to November after seasonal adjustment. This marked the tenth straight month of gains and a new record high. Home values in November were also 5.1% higher than a year earlier, with S&P DJI’s Head of Commodities, Brian D. Luke, noting that “November’s year-over-year gain saw the largest growth in U.S. home prices in 2023.”
The Federal Housing Finance Agency’s (FHFA) House Price Index also saw home prices rise 0.3% from October to November and 6.6% year-over-year, with their index setting new record highs in home prices every month since February. Note that FHFA’s report measures home price appreciation on single-family homes with conforming loan amounts, which means it most likely represents lower-priced homes.
FHFA also does not include cash buyers or jumbo loans, and these factors account for some of the differences in the two reports.
What’s the bottom line? Home prices are on pace to rise between 6-7% in 2023, based on the reported pace of appreciation through November. These indexes show that homeownership continues to provide opportunities for building wealth through real estate.
Family Hack of the Week
These crowd-pleasing Baked Chicken Wings from All recipes are easy to make and perfect for game day or any favorite celebration!
Preheat oven to 375 degrees Fahrenheit. In a large resealable bag, combine 3 tablespoons olive oil, 3 cloves pressed garlic, 2 teaspoons chili powder, 1 teaspoon garlic powder, and salt and pepper to taste. Add 10 to 12 chicken wings to the bag, reseal and shake to coat. Arrange chicken wings in a single layer on a baking sheet. Cook until wings are crisp, about 30 to 45 minutes. Enjoy wings with classics like Ranch dressing, carrots and celery sticks!
What to Look for This Week
This week’s economic calendar is much quieter than last week’s but there are a few key items to note. The latest Jobless Claims will be delivered on Thursday while investors will also be closely watching Wednesday’s 10-year Note and Thursday’s 30-year Bond auctions for the level of demand.
Technical Picture
Mortgage Bonds broke beneath their 25-day Moving Average on Friday and ended last week testing the next floor of support at their 50-day Moving Average. The 10-year ended last week just beneath resistance at the 25-day Moving Average. If this ceiling does not hold, there are three resistance levels close by.

